Tracking Withdrawals

So much is happening across the U.S. federal government right now that could reshape U.S. policy, influence, and capacity across a broad range of issues. With changes unfolding daily, no one can predict accurately how any particular area of interest or concern will resolve over time.
One clear example: public finance. Will the federal government drastically cut spending or simply slow its rate of growth? Will tens of thousands of federal jobs be eliminated from the budget? Will programs deemed critical to millions face deep cuts?
Tracking clear outcomes in real-time on federal finance is impossible. However, periodic U.S. financial data can provide some indication of status. The U.S. Treasury Monthly Statement provides some useful insight into agency-level, and in some cases program-level, spending and revenue.
Another option is the less granular Daily Treasury Statement, which tracks inflows (deposits) and outflows (withdrawals) of funds into specific agencies, programs, and activities. While its line items are limited and are not intended to depict financial outcomes, they can at least suggest whether revenue and spending are proceeding at expected levels—an especially relevant concern during these uncertain times.
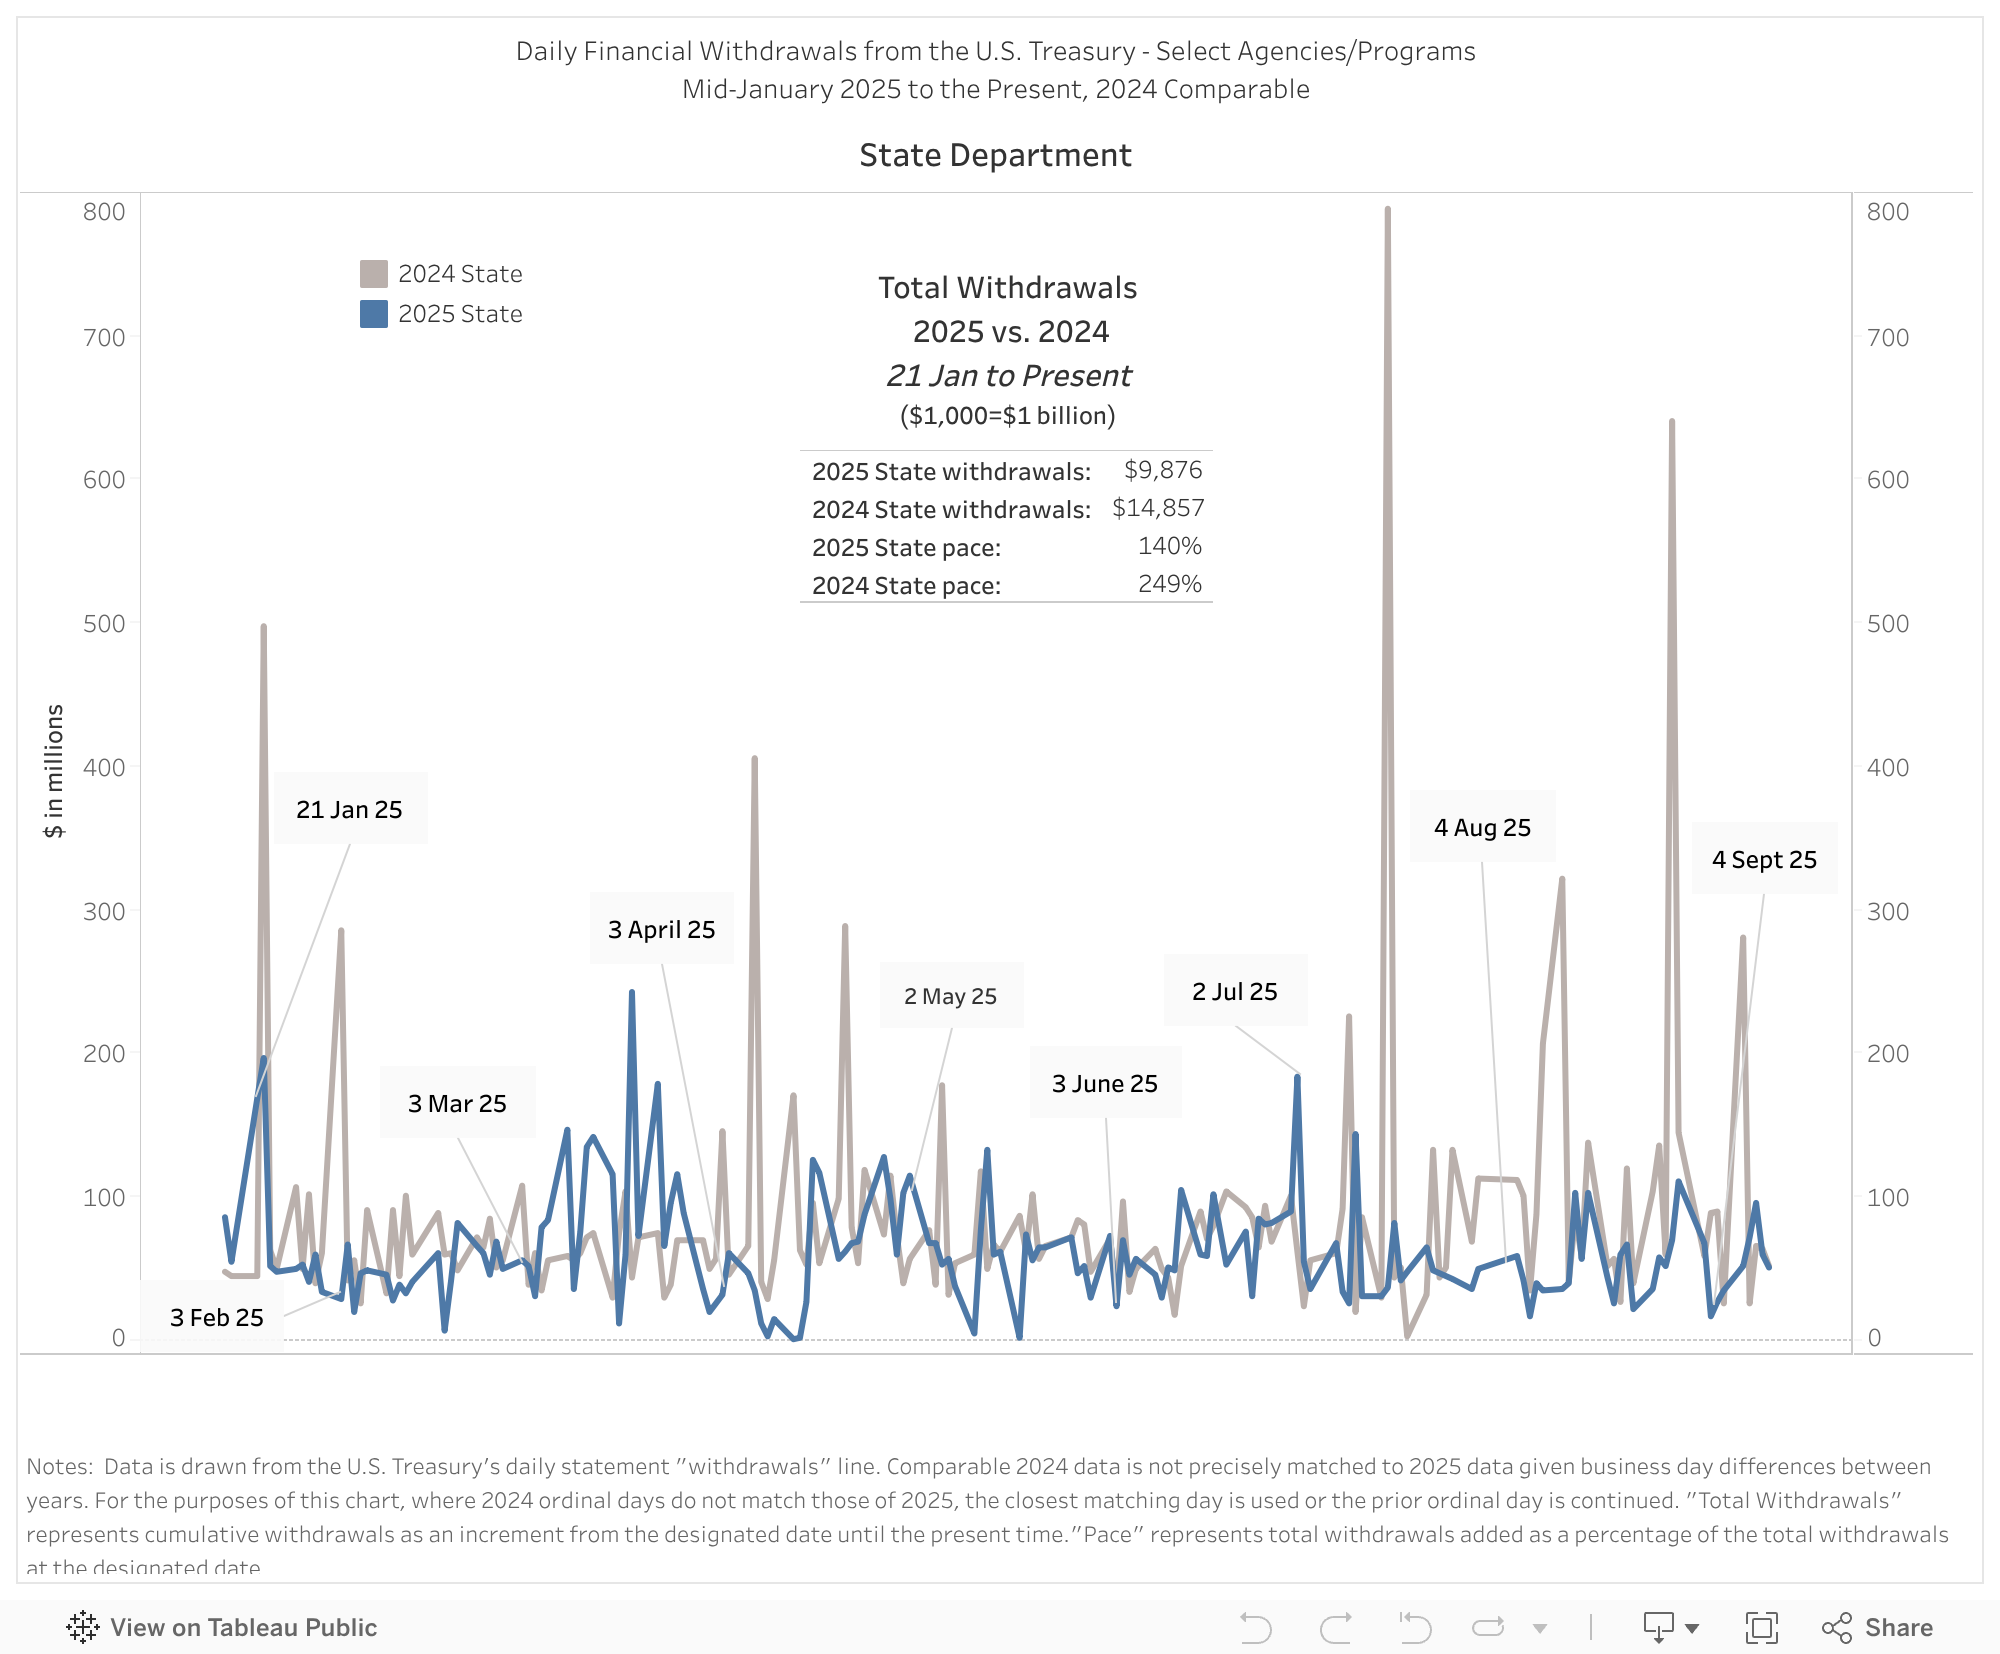
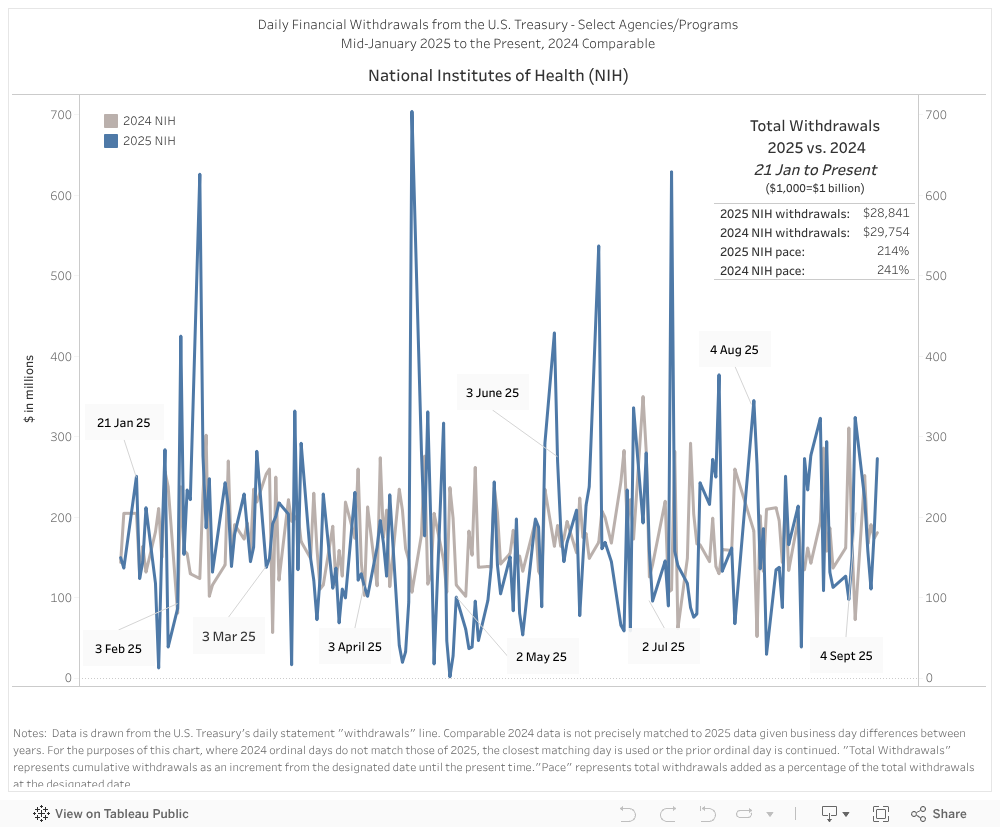
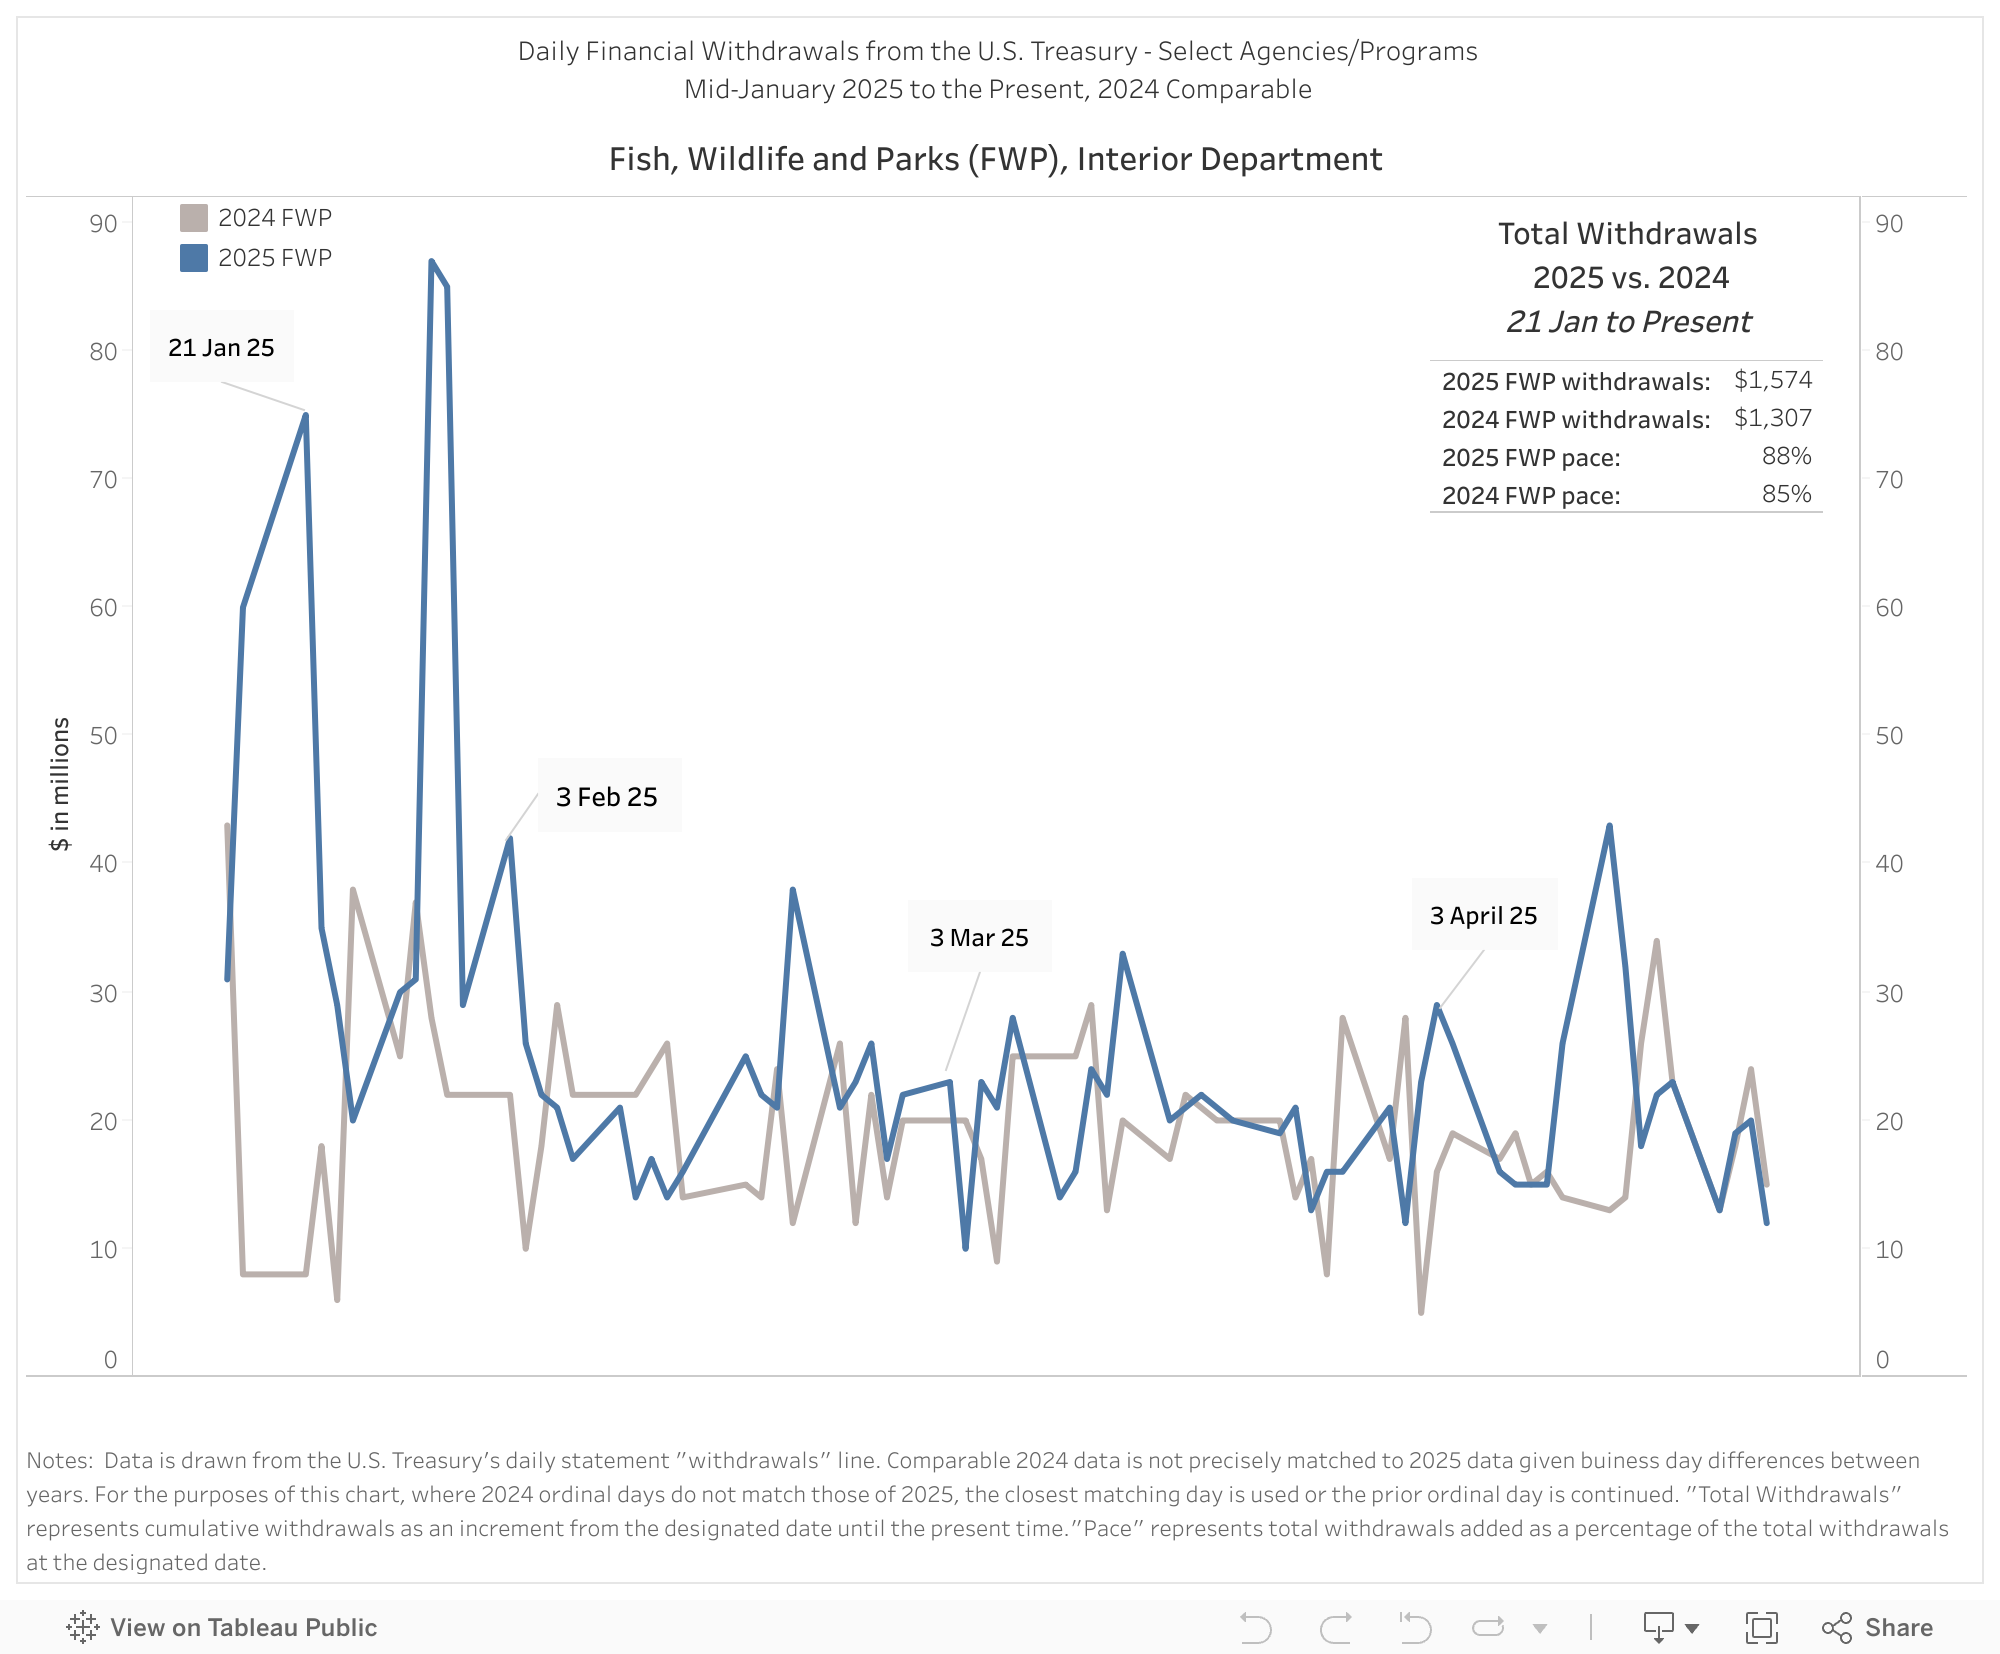
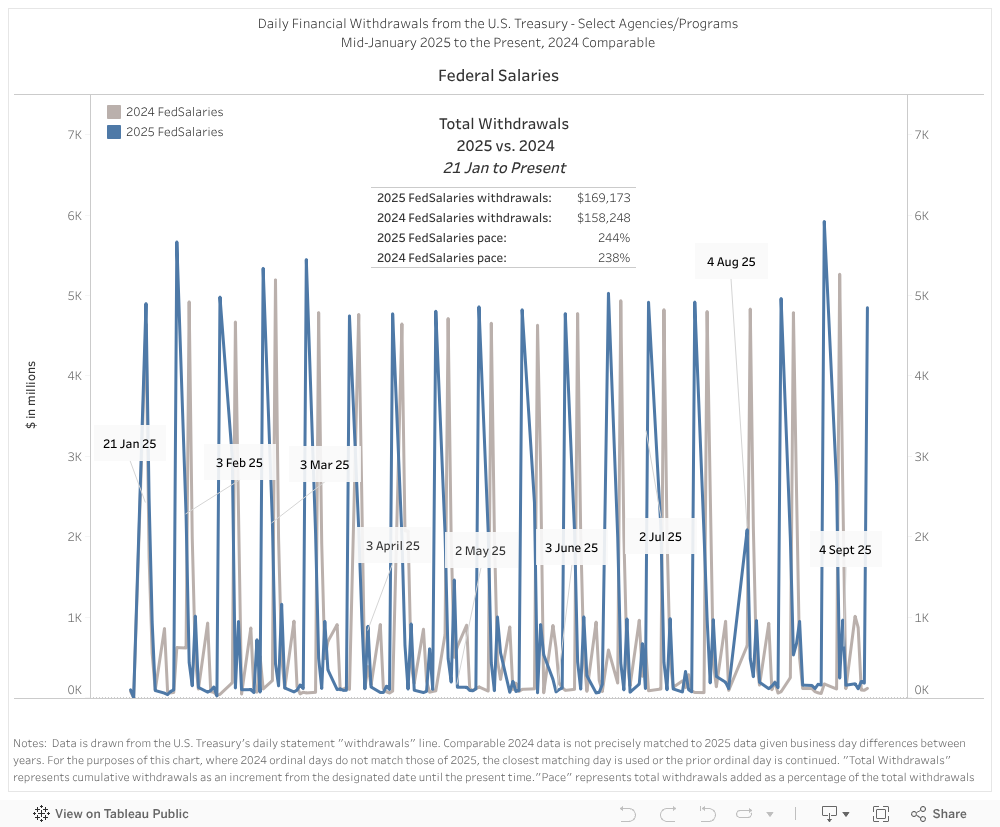
Below is a series of charts illustrating financial withdrawals from Daily Treasury Statements since mid-January, around President Trump’s inauguration. These compare daily withdrawals with those of 2024.
Some of the data confirms what you might expect. For instance, spending by the Agency for International Development (AID) recently slowed significantly for weeks. AID has been a key budget cut target of the Trump Administration. Other data may be more surprising.
This data will be updated as regularly as possible, with additional line-item charts added over time.
Mobile Users: please turn your phones horizontal.